Floor Plan Zoning Temps/Occupancy/Co2/Humidity with Time Lapse
- Draw Polygons
- Show Values
- Time Lapse Replay
- Auto Playback
- Colours change
- Navigate to Other Plans
- Create custom links
- Updates in real-time
- Zoom In/Out
- Layer Toggle
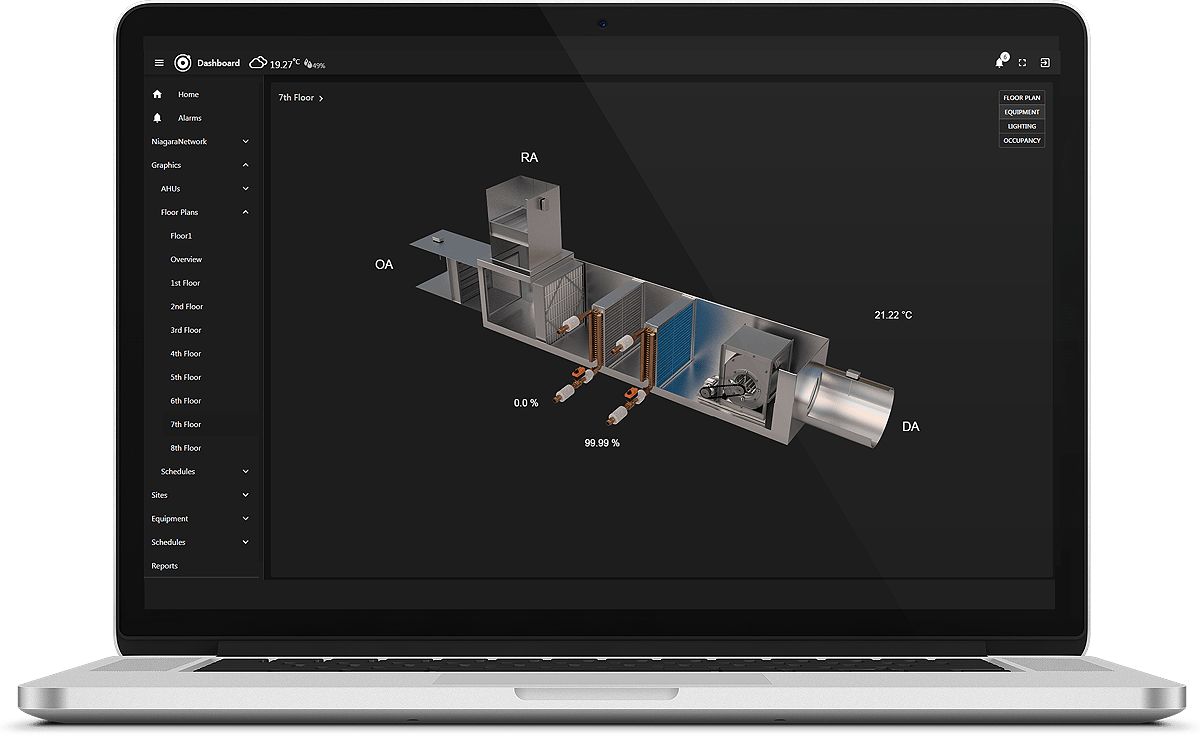
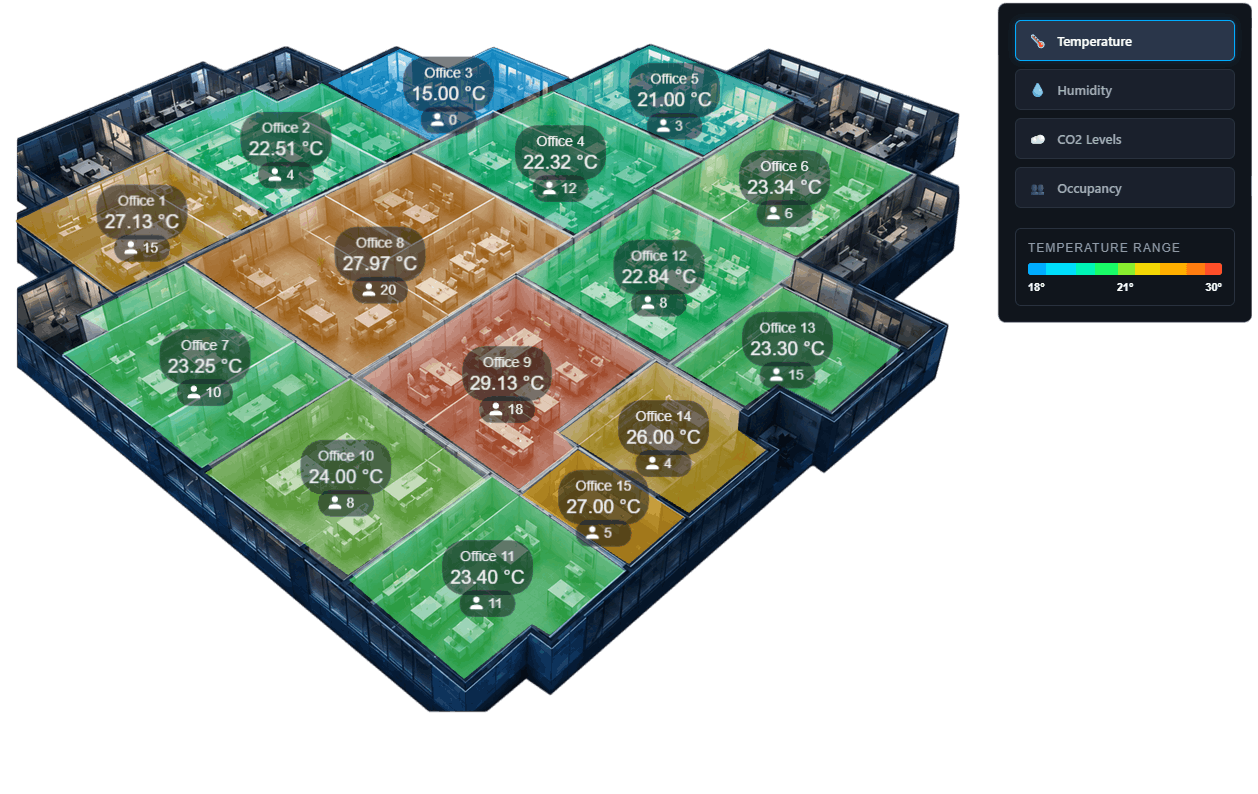
The Floor Plan Zoning widget allows you to add polygon shapes over an image and display point values with temperature, occupancy, co2, and humidity data. In design mode create polygons with ord references. When the widget is locked the image is displayed with clickable polygon areas. Point values update in real-time. Set values for min, optimal, and max. Shapes change colour in real-time. The widget has a number of configurable properties that can be used to modify look, feel, and functionality.
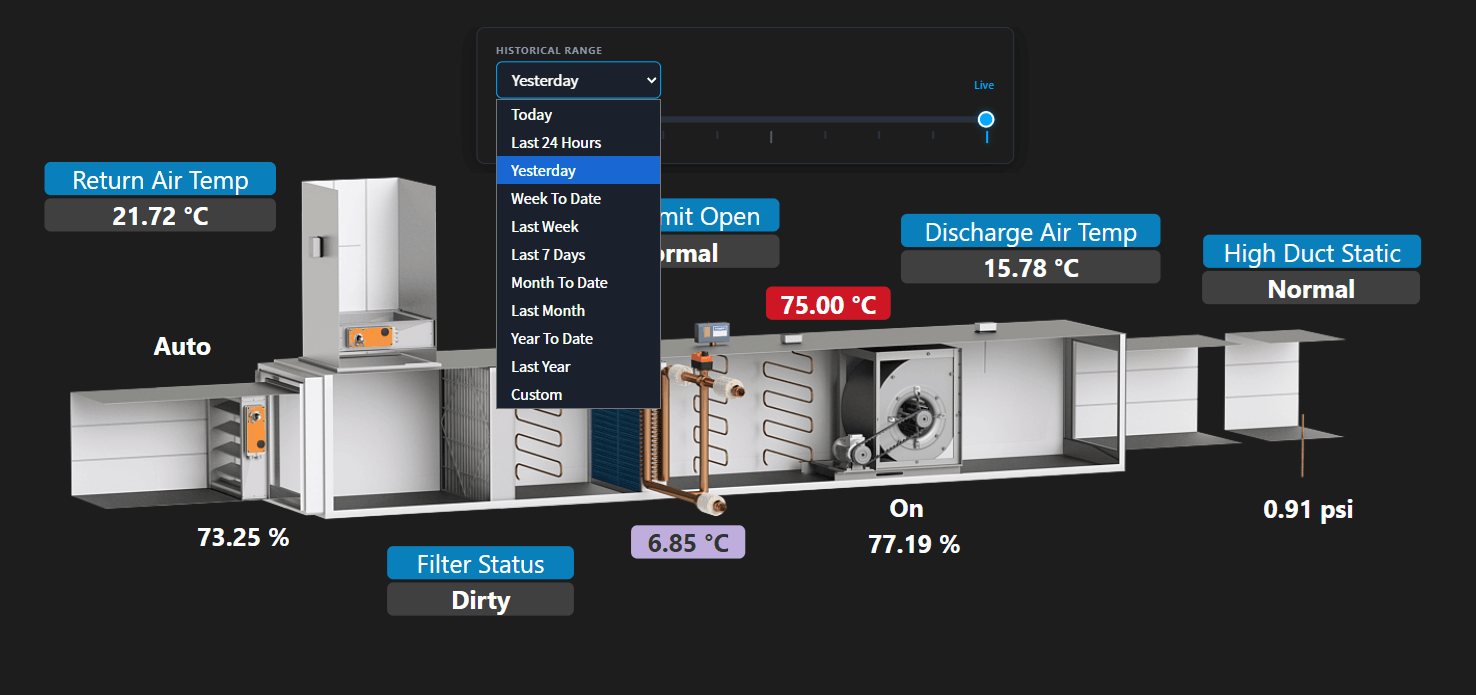
Use the time-lapse replay slider to navigate through historical data ranges (e.g. today, yesterday, this week, last week, month-to-date, year-to-date, last year, and custom). Apply a rollup to reduce the data. Use the play/pause to automate the slider for a smooth playback.
Are you looking for a cost effective way to manage and visualize data for all your customers? Why not have a look at View Builder?
Dynamic Polygon Tooling: Custom shapes are created using a snap-to-point drawing tool that maps to any structural area boundary.
Smooth mouse-wheel scaling and intuitive control inputs zoom straight toward the active cursor point, allowing effortless viewing of detailed workspace layouts
The custom linking engine turns every mapped room into a click-safe portal that opens system links or camera feeds in clean tabs, same windows, or an integrated popup without losing your layout.
Before you start. Download the modules from our portal (see your order confirmation, which also explains licensing). Copy the modules file to your modules directory. Restart BOTH station and Workbench.
1. Copy the floorPlanZoning-ux.jar file to your modules directory.
2. Open the module from your palette file.
3. Drag and drop the widget from the palette onto your px view.
1. Add to Px
Drag a FloorPlanZoning widget from the palette to the PX Page.
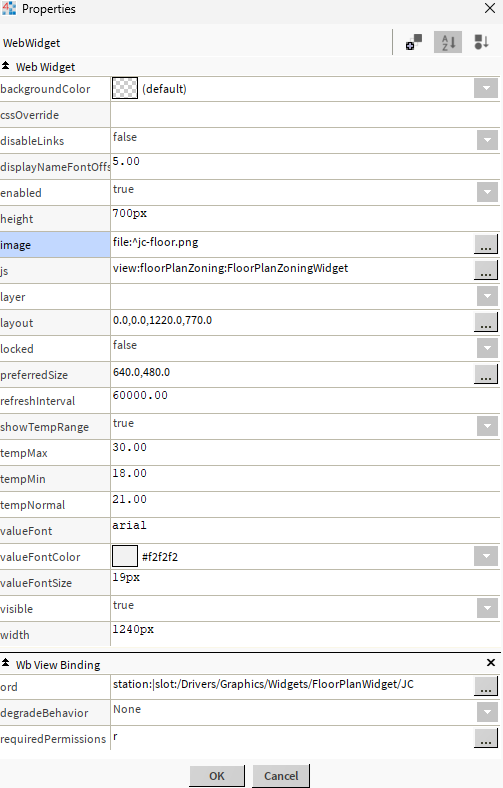
2. Set Properties
Set the image property. You may need to resize the image to make it fit within the px page. Do not use a very large image, keep it around 1200px width and 800px height.
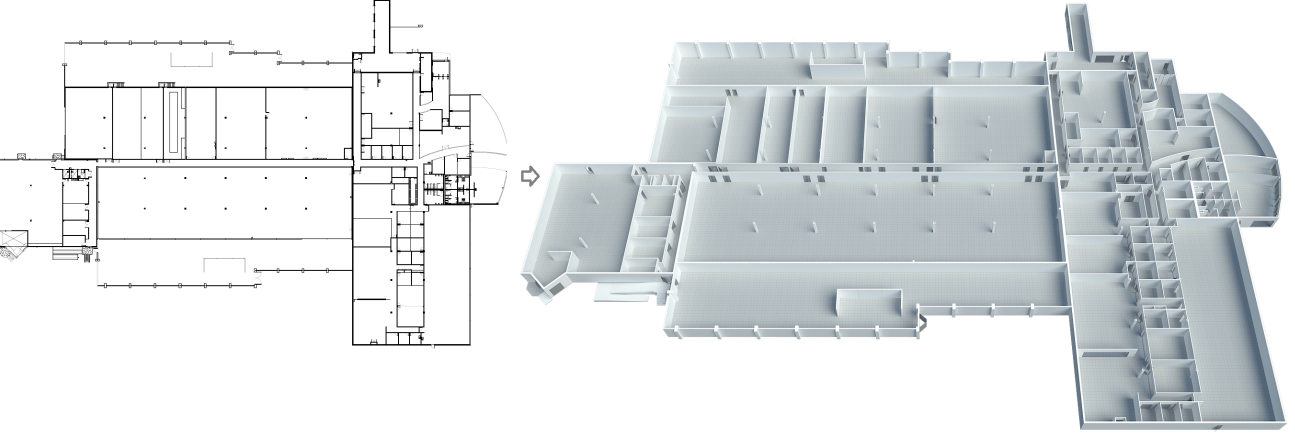
NOTE: we offer a 2d to 3d image conversion service at a very small cost. Please Contact Us us for a quote.
Set the widget value binding. Set this to the location of the graphics e.g. station:|slot:/Drivers/NiagaraNetwork
NOTE: you must set this to a station object otherwise the polygon configuration will not save.
3. Save the PX
Save the PX Page and open up the Workbench Browser or your normal browser to setup the polygons.
4. Create Polygons & Set Ords
Create polygons over the areas required. Use the tools at the top to add new polygons or set ords. After creating the first polygon, save the config, refresh the page. Ords should point to numeric points/writeables etc.
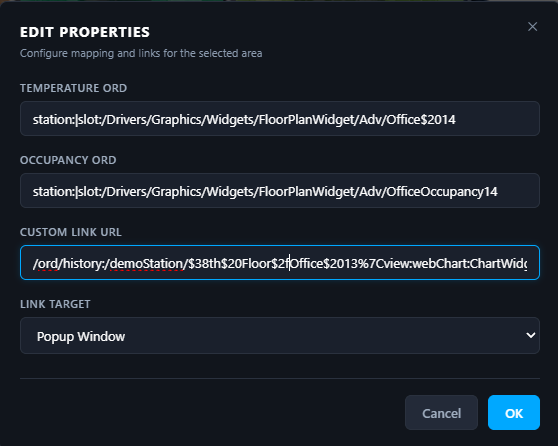
Set ords as required, click OK, then save the config.
Optionally, set the occupancy ord or the custom links.
Save often and test. NOTE: to start all over just delete the slot named floorplanConfig on the widget value binding you set earlier.
5. Save Config
When you're happy with all the polygons and ords, click the save icon in the top right to save the config. The config is saved as a dynamic slot on the widget value binding you set earlier.
6. Lock the Widget
In Workbench, go back to the widget properties and set the locked property to true.
This will hide the widget tools and show the image with all polygons and links. You can also disable all links if they are not required.
The link will navigate to the ord specified in the polygon.
Resizing,Height, and Width:
Resize the widget on the px page. Set the height and width on the widget properties to adjust image appearance. Try to keep it the same as the image dimensions.
Custom Link and link target:
Set to any link, like a dashboard link, or google.com. Target can be blank, self, parent, or top .
VB Dashboard Link:
/ord/file:%5Etemplates/viewBuilder/Niagara411_12_13_14/index.html%7Cview:web:FileDownloadView#/RoomOverview?ord=station:|slot:/Drivers/Graphics/Floor$20Plans/$325thFloor&displayName=25th%20Floor
History Link:
/ord/history:/demoStation/$38th$20Floor$2fOffice$2013%7Cview:webChart:ChartWidget
Polygon Properties (Double click the polygon to bring up):
Css Override:
To change some of the styling on screen, set this property e.g. Set legend background colour.
.legend-container { background: red !important }
Build Your Own dashboards and win Projects by showing data that increase value and reduces expenditure.