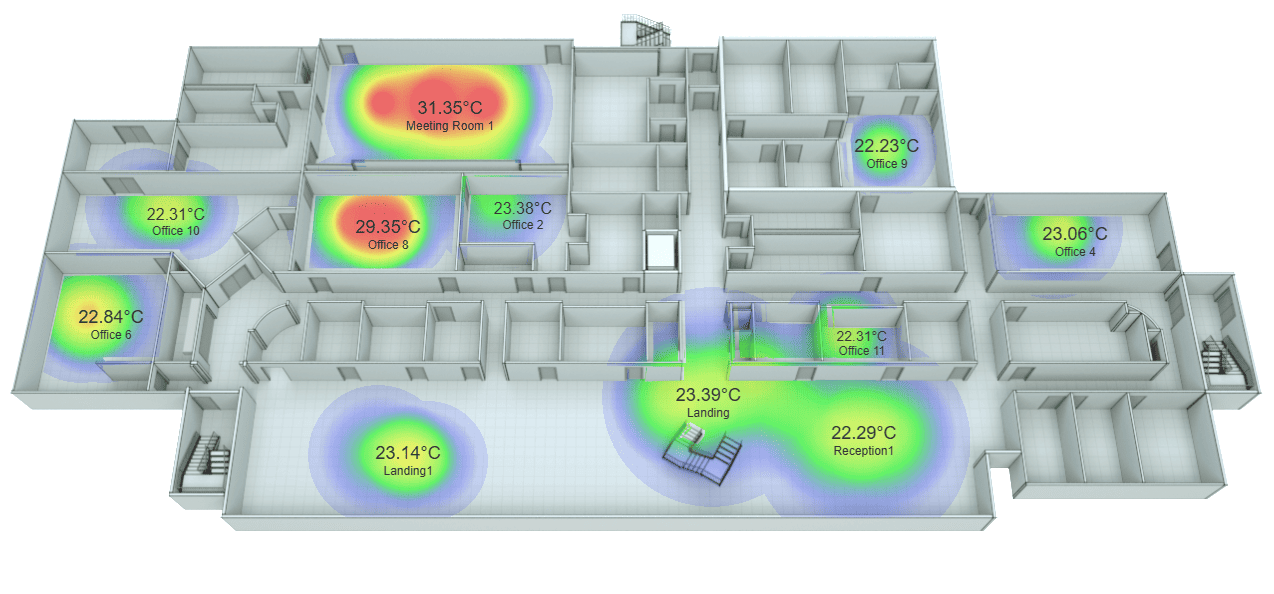
Floor Plan/Image Heatmap with Values
- Show spatial heat map data
- Pan/Zoom High Resolution Image
- Add masking image
- Add Values & Links
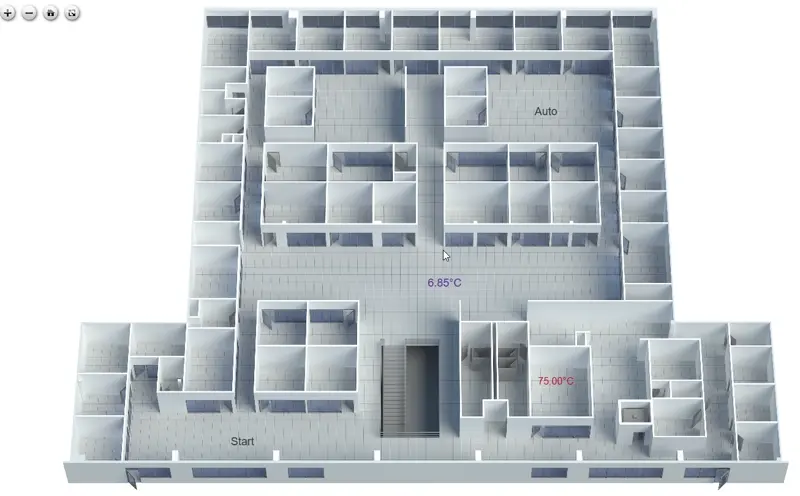
- Show Points Values
- Values/Screen updates in Real-time
- Works in Workbench and Modern Browser
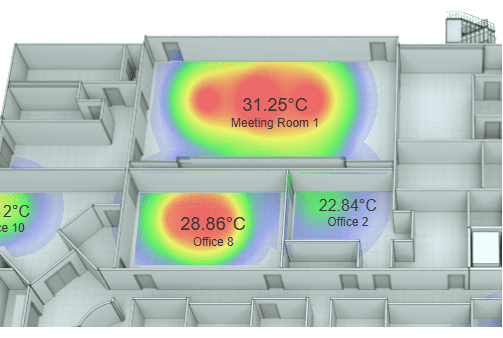
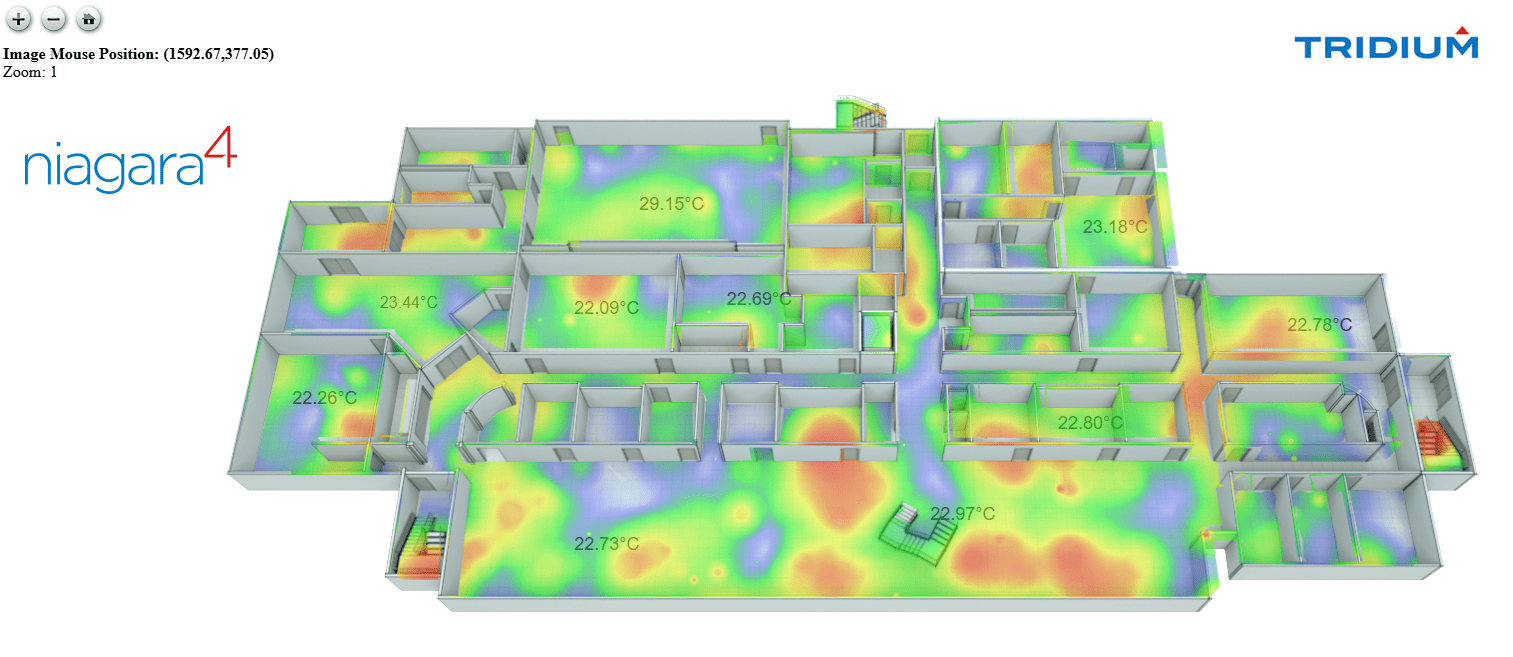
Floorplan/heatmap widget for N4. Using temperature sensor data to visualize data to spot trends, hotspots, or areas for improvement (e.g., foot traffic, temperature, energy usage) By adding point values at varying zoom levels, it provides a flexible solution for displaying detailed information. This is particularly useful when working with intricate floor plans or images where labels might become cluttered. The Floor Plan/Image Heatmap alleviates this issue by allowing users to reveal point values at specific zoom levels, ensuring clarity and precision.
The building engineer will need to place sensors on the image, simply by moving the mouse around, and noting the x/y coordinates on the image. Can also zoom in/out to get a closer look. Add real-time values to show actual data collected. This allows the engineer to make adjustments to their mechanical systems so buildings run more efficiently and occupants are more comfortable.
Before you start, update licenses/certs, copy the .jar file to your modules directory. Restart the station and Workbench.
Heat Map:
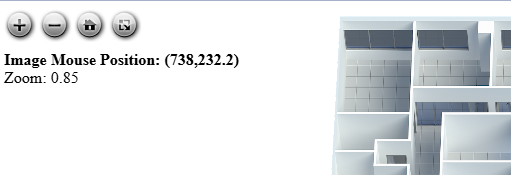
Zoom In/Out and Pan:
Are you looking for a cost effective way to manage and visualize data for all your customers? Why not have a look at View Builder?
Before you start. Download the modules from our portal (see your order confirmation, which also explains licensing). Update licenses and certs. Copy the modules file to your modules directory. Restart BOTH station and Workbench.
1. Copy the floorImageHeatmapWithValues-ux.jar file to your modules directory.
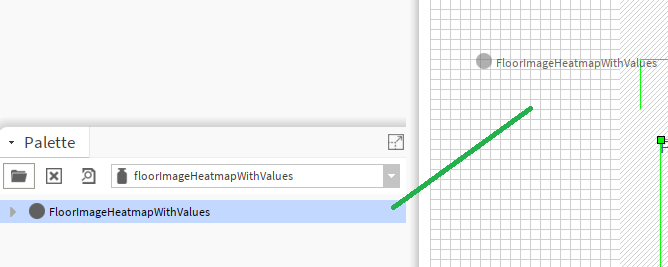
2. Open the module from your palette file.
3. Drag and drop the widget from the palette onto your px view.
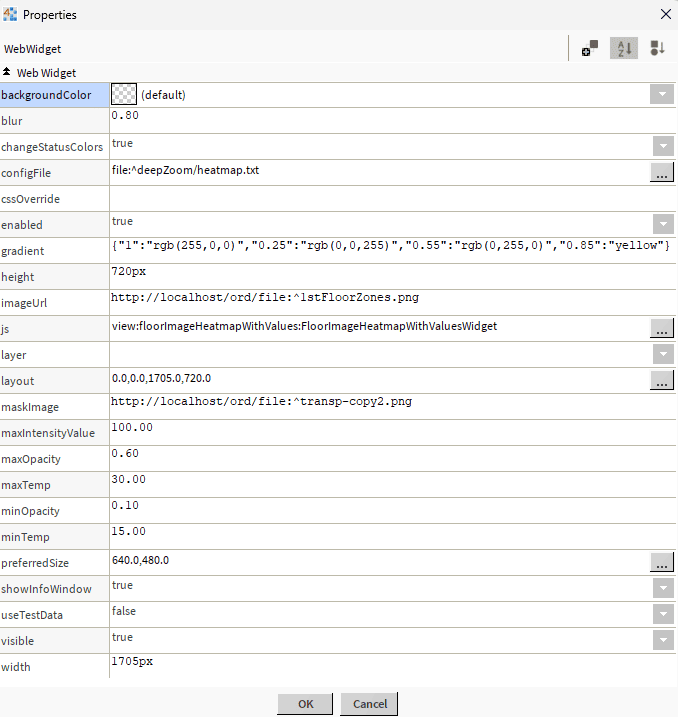
The widget has a number of configurable properties that can be used to modify look, feel, and functionality. Change the properties as required:
Image Url/Mask Image Url:
The URL of the image shown on the widget. Must reside on the station or hosted elsewhere with a url format. e.g http://localhost/ord/file:^1stFloorZones.png
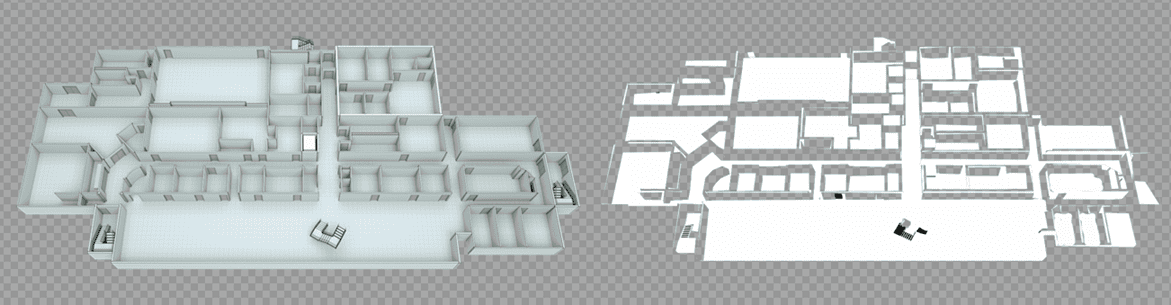
Mask the heatmap canvas using the floor plan’s walkable areas (rooms + corridors). Create an image exactly like the main image. If no mask image is used then it will bleed through the walls, rooms etc.
White = allowed (rooms, corridors)
Transparent = blocked (walls, outside)
You can use AI to create a mask image, and then touch it up with Gimp, or paint. Also contact us if you would like one generated as we have more advanced photo editing tools.
Output:
Show Info Window:
This will show the mouse x/y position for setting up labels/points.
Figuring out the X/Y coordinates of the label:
Make sure showInfoWindow property is set to true. Then click on the HOME button to reset the image zoom. Move the mouse to where you think the top-left corner of label should be positioned.
Change Status Colors:
When true it will change the text color to the status of the point.
Config File:
This is a json config file residing in your stations shared folder which contains points, links, etc.
See below for full example. e.g. file:^config.txt
{
  "objects": [
    {
      "id": "Meeting$20Room$201",
      "minZoomLevel": 0,
      "maxZoomLevel": 14,
      "x": 615,
      "y": 173,
      "ord": "station:|slot:/Drivers/Graphics/Floor$20Plans/$31st$20Floor/Meeting$20Room$201",
      "fontSize": "18px",
      "fontColor": "#333333",
      "showAtStartup": true,
      "link": "/ord/station:|slot:/Drivers/Graphics/Floor$20Plans/$31st$20Floor/Meeting$20Room$201",
      "linkTarget": "",
      "sensorPoints": [
        {
          "x": 600,
          "y": 180,
          "value": 0,
          "radius": 50
        },
        {
          "x": 650,
          "y": 180,
          "value": 0,
          "radius": 110
        },
        {
          "x": 700,
          "y": 180,
          "value": 0,
          "radius": 70
        }
      ]
    },
    {
      "id": "office2",
      "minZoomLevel": 0,
      "maxZoomLevel": 14,
      "x": 688,
      "y": 276,
      "ord": "station:|slot:/Drivers/Graphics/Floor$20Plans/$31st$20Floor/Office$202",
      "fontSize": "16px",
      "fontColor": "#333333",
      "showAtStartup": true,
      "link": "",
      "linkTarget": "",
	  "sensorPoints": [
        {
          "x": 714,
          "y": 279,
          "value": 0,
          "radius": 70
        },
        {
          "x": 650,
          "y": 180,
          "value": 0,
          "radius": 110
        },
        {
          "x": 700,
          "y": 180,
          "value": 0,
          "radius": 70
        }
      ]
    },
    {
      "id": "reception1",
      "minZoomLevel": 0,
      "maxZoomLevel": 14,
      "x": 1030,
      "y": 499,
      "ord": "station:|slot:/Drivers/Graphics/Floor$20Plans/$31st$20Floor/Reception1",
      "fontSize": "18px",
      "fontColor": "#333333",
      "showAtStartup": true,
      "link": "",
      "linkTarget": "",
	  "sensorPoints": [
        {
          "x": 1049,
          "y": 509,
          "value": 0,
          "radius": 70
        },
        {
          "x": 1079,
          "y": 520,
          "value": 0,
          "radius": 110
        },
        {
          "x": 1109,
          "y": 511,
          "value": 0,
          "radius": 70
        }
      ]
    },
	{
      "id": "landing",
      "minZoomLevel": 0,
      "maxZoomLevel": 14,
      "x": 874,
      "y": 461,
      "ord": "station:|slot:/Drivers/Graphics/Floor$20Plans/$31st$20Floor/Landing",
      "fontSize": "18px",
      "fontColor": "#333333",
      "showAtStartup": true,
      "link": "",
      "linkTarget": "",
	  "sensorPoints": [
        {
          "x": 890,
          "y": 475,
          "value": 0,
          "radius": 70
        },
        {
          "x": 930,
          "y": 475,
          "value": 0,
          "radius": 110
        },
        {
          "x": 980,
          "y": 455,
          "value": 0,
          "radius": 70
        }
      ]
    },
    {
      "id": "office4",
      "minZoomLevel": 0,
      "maxZoomLevel": 14,
      "x": 1242,
      "y": 300,
      "ord": "station:|slot:/Drivers/Graphics/Floor$20Plans/$31st$20Floor/Office$204",
      "fontSize": "18px",
      "fontColor": "#333333",
      "showAtStartup": true,
      "link": "",
      "linkTarget": "",
	  "sensorPoints": [
        {
          "x": 1272,
          "y": 307,
          "value": 0,
          "radius": 70
        },
        {
          "x": 1282,
          "y": 308,
          "value": 0,
          "radius": 40
        }
      ]
    },
    {
      "id": "office6",
      "minZoomLevel": 0,
      "maxZoomLevel": 14,
      "x": 275,
      "y": 383,
      "ord": "station:|slot:/Drivers/Graphics/Floor$20Plans/$31st$20Floor/Office$206",
      "fontSize": "18px",
      "fontColor": "#333333",
      "showAtStartup": true,
      "link": "",
      "linkTarget": "",
	  "sensorPoints": [
        {
          "x": 297,
          "y": 391,
          "value": 0,
          "radius": 70
        },
        {
          "x": 300,
          "y": 395,
          "value": 0,
          "radius": 50
        },
        {
          "x": 320,
          "y": 391,
          "value": 0,
          "radius": 70
        }
      ]
    },
    {
      "id": "landing1",
      "minZoomLevel": 0,
      "maxZoomLevel": 14,
      "x": 573,
      "y": 519,
      "ord": "station:|slot:/Drivers/Graphics/Floor$20Plans/$31st$20Floor/Landing1",
      "fontSize": "18px",
      "fontColor": "#333333",
      "showAtStartup": true,
      "link": "",
      "linkTarget": "",
	  "sensorPoints": [
        {
          "x": 595,
          "y": 534,
          "value": 0,
          "radius": 70
        },
        {
          "x": 625,
          "y": 532,
          "value": 0,
          "radius": 50
        },
        {
          "x": 645,
          "y": 540,
          "value": 0,
          "radius": 60
        }
      ]
    },
    {
      "id": "office8",
      "minZoomLevel": 0,
      "maxZoomLevel": 14,
      "x": 553,
      "y": 293,
      "ord": "station:|slot:/Drivers/Graphics/Floor$20Plans/$31st$20Floor/Office$208",
      "fontSize": "18px",
      "fontColor": "#333333",
      "showAtStartup": true,
      "link": "",
      "linkTarget": "",
	  "sensorPoints": [
        {
          "x": 573,
          "y": 300,
          "value": 0,
          "radius": 70
        },
        {
          "x": 596,
          "y": 301,
          "value": 0,
          "radius": 50
        },
        {
          "x": 609,
          "y": 302,
          "value": 0,
          "radius": 60
        }
      ]
    },
    {
      "id": "office9",
      "minZoomLevel": 0,
      "maxZoomLevel": 14,
      "x": 1053,
      "y": 212,
      "ord": "station:|slot:/Drivers/Graphics/Floor$20Plans/$31st$20Floor/Office$209",
      "fontSize": "18px",
      "fontColor": "#333333",
      "showAtStartup": true,
      "link": "",
      "linkTarget": "",
	  "sensorPoints": [
        {
          "x": 1098,
          "y": 227,
          "value": 0,
          "radius": 40
        },
        {
          "x": 1105,
          "y": 228,
          "value": 0,
          "radius": 50
        }
      ]
    },
    {
      "id": "office10",
      "minZoomLevel": 0,
      "maxZoomLevel": 14,
      "x": 340,
      "y": 282,
      "ord": "station:|slot:/Drivers/Graphics/Floor$20Plans/$31st$20Floor/Office$2010",
      "fontSize": "16px",
      "fontColor": "#333333",
      "showAtStartup": true,
      "link": "/ord/station:|slot:/Drivers/Graphics/Floor$20Plans/$31st$20Floor/Office$2010",
      "linkTarget": "",
	  "sensorPoints": [
        {
          "x": 361,
          "y": 286,
          "value": 0,
          "radius": 60
        },
        {
          "x": 382,
          "y": 286,
          "value": 0,
          "radius": 50
        },
		{
          "x": 405,
          "y": 288,
          "value": 0,
          "radius": 50
        }
      ]
    },
    {
      "id": "office11",
      "minZoomLevel": 0,
      "maxZoomLevel": 14,
      "x": 1028,
      "y": 404,
      "ord": "station:|slot:/Drivers/Graphics/Floor$20Plans/$31st$20Floor/Office$2011",
      "fontSize": "14px",
      "fontColor": "#333333",
      "showAtStartup": true,
      "link": "/ord/station:|slot:/Drivers/Graphics/Floor$20Plans/$31st$20Floor/Office$2011",
      "linkTarget": "blank",
	  "sensorPoints": [
        {
          "x": 1060,
          "y": 408,
          "value": 0,
          "radius": 60
        },
        {
          "x": 1065,
          "y": 410,
          "value": 0,
          "radius": 50
        }
      ]
    }
  ]
}
JSON Values Explained:
id- each item needs to have a unique id number.
minZoomLevel- this is the min zoom level for the point value to appear. Possible values 0-14. Say you set this to 2, when the image is zoomed in, the point will show up when the image is at zoom level 2
maxZoomLevel- this is the max zoom level for the point value to appear. Possible values 0-14. Say you have set this to 1.5, and min to 0, then it will be hidden after zoom level 1.5.
x- the x position of the point on the image. Set the show info window to true, so when setting up the image, you can determine its x/y position.
x- the y position of the point on the image. Set the show info window to true, so when setting up the image, you can determine its x/y position.
ord - ord reference to point
fontSize, fontColor - styling of the point value
showAtStartup - the label will show up when the image loads. Also set minZoomLevel to 0
link- link to when clicked on point. Must be web format: /ord/station:|slot:/Drivers/Graphics/AHUs. Leave blank for no link.
linkTarget- link to target window. Default is parent. Possible values: blank, self, parent, or top.
sensorPoints - theses are the heat distribution points for the sensor. Its recommended to have a few for each point. As point values update, so do the sensors.
sensorPoints (x/y) - location on image
sensorPoints (value) - auto calculated. value = (temperature - minTemp) / (maxTemp - minTemp)
sensorPoints (radius) - radius represents sensor influence area (More info above)
JSON Editing
To help build your menu configuration use an online JSON editor like:
https://jsoneditoronline.org/
Heres a sample files to help you get started.
Download
Height/Width:
The height/width of the image and mask must match. The widget layout properties must also match the image size. See property sheet example above.
Gradient:
This is the diverging color. e.g. blue → neutral → red in json object format.
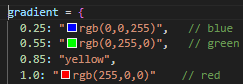
{"1":"rgb(255,0,0)","0.25":"rgb(0,0,255)","0.55":"rgb(0,255,0)","0.85":"yellow"}
Min Temp/Max Temp:
The min temp and max temps to be used for the value calculation. Default is in Celcius. Min = 15, Max = 30. If recording in fahrenheit, change accordingly.
Radius is not a property of the sensor reading.
It represents how far that sensor's influence should visually spread.
So there is no single "correct" radius — it's a modeling choice grounded in building physics + visualization goals.
radius = influence distance in IMAGE PIXELS (at zoom = 1)
So your job is to decide:
“How far does this sensor reasonably affect the surrounding space?”
Pick one value based on layout:
| Environment | -Typical radius |
|---|---|
| Small rooms | 1–2 m |
| Office floor | 2–4 m |
| Hallways | 3–6 m |
| Open atrium | 5–10 m |
Let’s say:
sensorInfluenceMeters = 3;
You only do this one time per floor plan.
Using mouse clicks:
Now compute:
pixelsPerMeter = pixelDistance / realDistanceMeters;
Store this value.
radiusPx = sensorInfluenceMeters * pixelsPerMeter;
If you want better realism:
❌ Don’t derive radius from temperature
❌ Don’t scale radius per zoom (already does this)
❌ Don’t guess pixel values without calibration
If you want something that works today:
This will look right on almost any office floor.
You’re building a spatial influence map, not plotting raw points.
Build Your Own dashboards and win Projects by showing data that increase value and reduces expenditure.